Sklearn - Local Outlier Factor (LOF)
Data
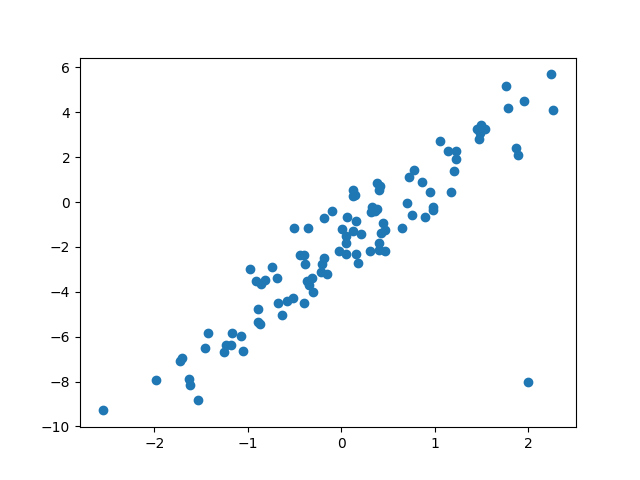
Scatterplot

np.random.seed(0)
m = 100

x = np.random.randn(m).reshape(-1, 1)
y = 3 * x - 2 + np.random.randn(m).reshape(-1, 1)

x = np.concatenate((x, [[2]]), axis=0)
y = np.concatenate((y, [[-8]]), axis=0)

plt.scatter(x,y)

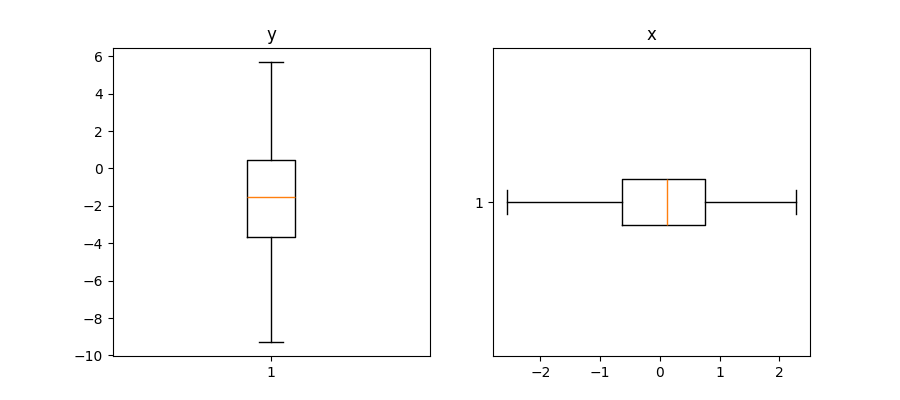
Boxplots

fig, ax = plt.subplots(1, 2, figsize=(9,4))
ax[0].boxplot(y)
ax[0].set_title('y')
ax[1].boxplot(x, vert=False)
ax[1].set_title('x')

Box plots
→
Aucun outlier en analyse univariée x ou y
LOF
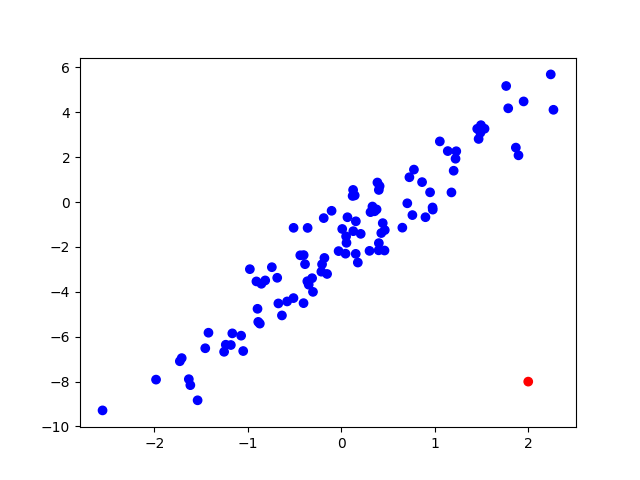
Scatterplot avec LOF

data = np.concatenate((x, y), axis=1)
detection_model = LocalOutlierFactor(contaminations=0.01, n_neighbors=5)
outliers = detection_model.fit_predict(data)
plt.scatter(x, y, c=outliers, cmaps='bwr_r')

contamination=0.01 => 1% de détections
n_neighbors=5 => voisins impliqués dans l'isolation
n_neighbors=5 => voisins impliqués dans l'isolation
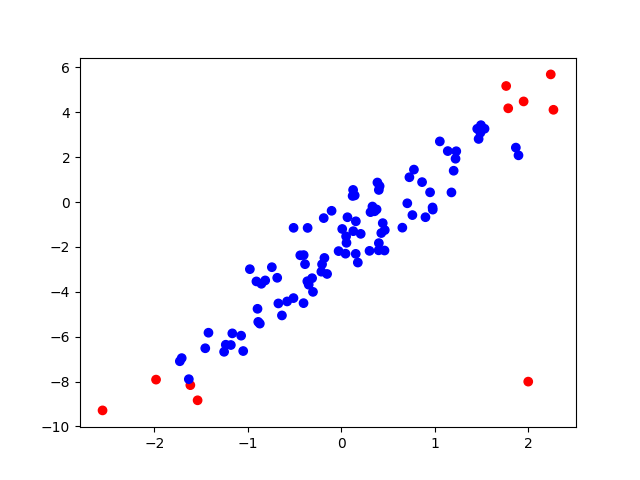
Scatterplot avec LOF

data = np.concatenate((x, y), axis=1)
detection_model = LocalOutlierFactor(contaminations=0.1, n_neighbors=10)
outliers = detection_model.fit_predict(data)
plt.scatter(x, y, c=outliers, cmaps='bwr_r')

contamination=0.1 => 10% de Valeurs abberantes